var jsondata = {
row1 : {
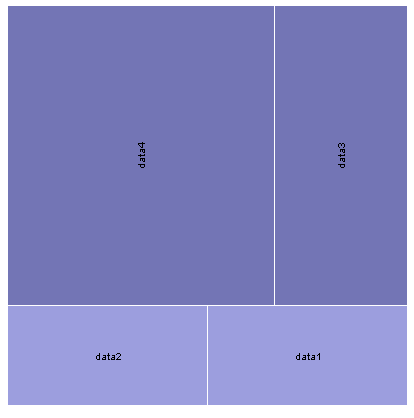
data1 : 10,
data2 : 10,
},
row2 : {
data3 : 20,
data4 : 40,
}
};
var pvdom = pv.dom(jsondata);
//recursive functions
function title(d) {
return d.parentNode ? (title(d.parentNode) + "." + d.nodeName) : d.nodeName;
}
var re = "",
color = pv.Colors.category19().by(function(d) d.parentNode.nodeName),
datanodes = pvdom.root("hanya-nama").nodes(); //change it to array
var vis = new pv.Panel()
.width(400)
.height(400);
var treemap = vis.add(pv.Layout.Treemap)
.nodes(datanodes)
.round(true);
treemap.leaf.add(pv.Panel)
.fillStyle(function(d) color(d).alpha(title(d).match(re) ? 1 : .2))
.strokeStyle("#fff")
.lineWidth(1)
.antialias(false);
treemap.label.add(pv.Label)
.textStyle(function(d) pv.rgb(0, 0, 0, title(d).match(re) ? 1 : .2));
vis.render();
Reference :


